7.5 Setting Thresholds on Charts
7.5.1 Specifying a Horizontal Line on the Chart that Represents a Threshold Value
To setup a threshold line on a chart:
-
In the view, right-click a chart, then select to open the Properties page.
-
In the left pane, click to display the Thresholds property page:
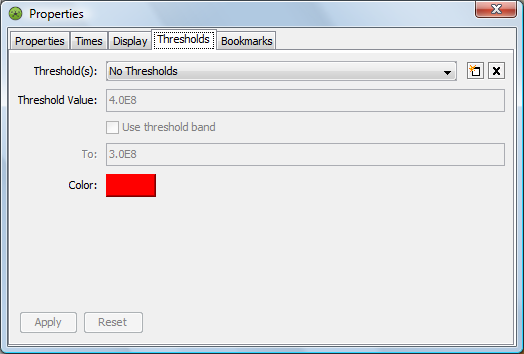
-
Click .
-
Specify a value in the field.
The line is drawn at this value on the Y‑axis.
-
Click the colored rectangle, then select a color from the palette.
-
Click .
A horizontal line in the selected color displays across the chart along the specified threshold value on the Y‑axis.
7.5.2 Selecting a Threshold when Multiple Thresholds Have Been Set
To select a threshold:
-
In the chart’s Thresholds property page, click the drop-down list, then select a threshold.
7.5.3 Drawing a Thicker Threshold Band
To expand the width of the threshold band:
-
In the chart’s Thresholds property page, select the check box.
-
Specify a second value in the number box to draw the threshold band between the values specified in the To and Threshold Value number boxes.
7.5.4 Deleting the Current Threshold
To delete a threshold:
-
In the chart’s Thresholds property page, select the desired threshold in the Threshold drop-down list, then click .
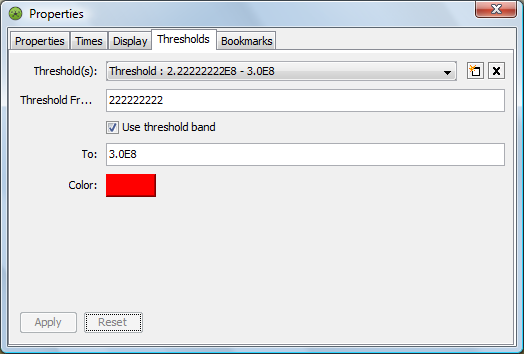
The threshold setting disappears from the drop-down list.