4.2 Viewing Experience Manager Monitor Status and Metrics
The Experience Manager Monitor status is updated automatically. In the Explorer pane, the colored diamonds beside the Experience Manager Monitors indicate the status. Table 4-1 describes the color codes.
Table 4-1 Experience Manager Monitor Status Colors
|
Status Color |
Description |
||
|---|---|---|---|
|
|
A connection exists between Operations Center and the Experience Manager Monitor. |
||
|
|
The monitor has not started, or if it has started, it might have a connection problem. If the monitor can successfully push alarms to the Operations Center server, the indicator changes back to green. |
||
|
|
A heartbeat communication problem with the monitor is probable. |
||
|
|
A heartbeat communication with the monitor has failed 10 times. |
 Green
Green
 Gray
Gray
 Yellow
 Red
Red
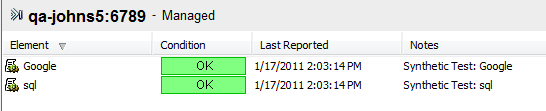
The monitor status is also summarized on the View pane title bar. The condition indicators display and the title bar indicates the adapter has started:
Figure 4-1 The Operations Center Title Bar Shows Status for the Monitor Element
NOTE:To hide or display the status indicators, right-click anywhere in the Explorer pane background, then select or deselect . When the option is selected, the indicators display.
To view monitor metrics and statistics in the monitor’s property pages:
-
In the Explorer pane, expand the root element > > > .
-
Right-click the monitor, then click . The Status property page opens.
-
In the left pane, click .
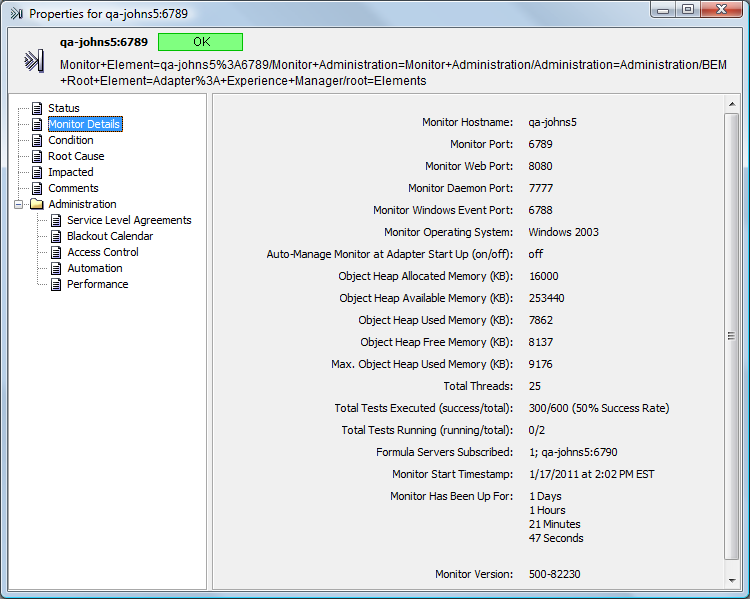
The Monitor Details property page displays all metrics for the monitor: